Add a Map to a Report
Power BI
Declare Galigeo for Power BI via Microsoft AppSource
Open your Power BI Desktop, or connect to Power BI Online. Open an existing report or create a new one, and switch to Edit mode.
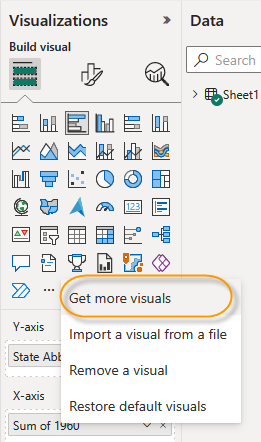
Open the Visualization panel on the right, click on the "..." icon and select Import a visual from file.
The page Power BI visuals from Microsoft AppSource opens. In the search zone enter the key word Galigeo.
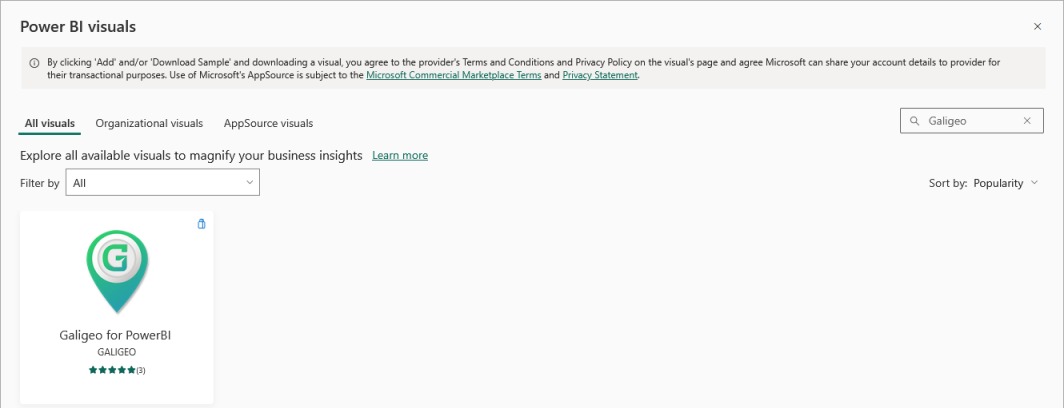
Click on the Galigeo for Power BI widget to gain access to the visual.
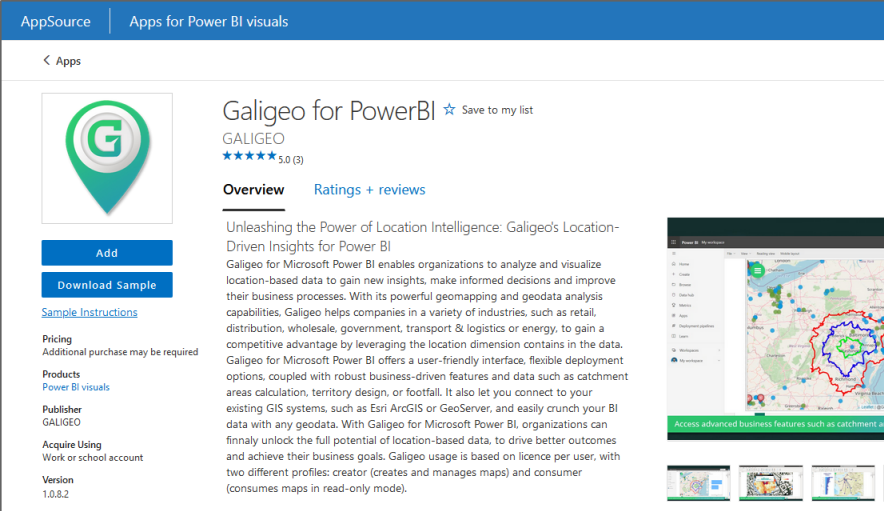
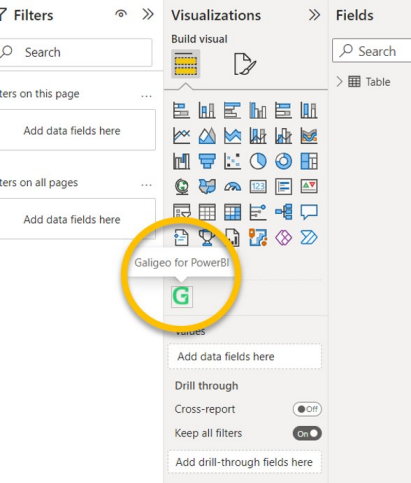
Click on the Add button and after a few seconds, you will see the Galigeo Visual ready to be used from the Visualizations panel.
Insert a Galigeo Map in a Report
Click on the Galigeo icon from the Visualization list, a new visualization will be placed on your report. By default, the Galigeo Visual is blank, you need to add data to it in order to start configuring it.
Select the Galigeo Visual on the report, and assign the data you want to it, using the standard Power BI way of assigning data. Note that at this point you can already freely resize the Galigeo Visual, like any other visual.
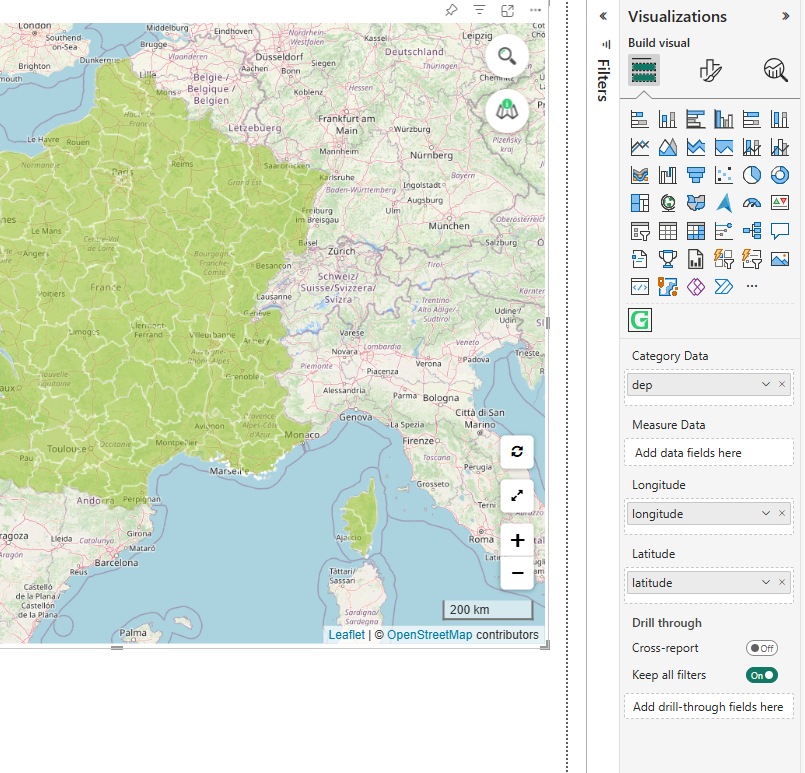
In the Build visual tab of the Visualizations panel, you will find the following data fields:
- Category Data: drag and drop the field that identifies your data (e.g. a region code, a city name, etc.)
- Measure Data: optionally, drag and drop one or more measure fields to display on the map
- Longitude: drag and drop the field containing the longitude values of your data points
- Latitude: drag and drop the field containing the latitude values of your data points
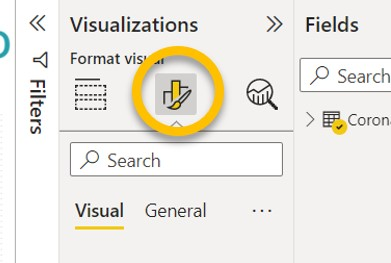
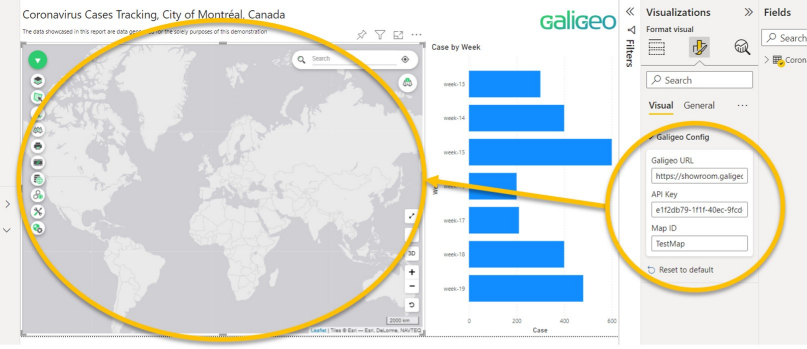
On the Visualization tab, click on the Format your visual icon, and open the Galigeo Config menu. Here, you will have to fill in three inputs, as follow:
- Galigeo URL: the URL pointing to your Galigeo environment (the URL is provided to you in the mail following your trial request)
- API Key: the Galigeo API Key in order to activate your license (the API Key is provided to you in the mail following your trial request)
- Map ID: a unique ID for this map
When this is done, the Galigeo Visual will start loading.
The Report interactions switch button, when lit, allows the map to interact with the other graphs of the current report. In this case, the first field of Category Data of the data assigned to the card is used. The element clicked on the map is highlighted in the other graphs of the current tab.
You can now visualize and analyze your Power BI data in the Galigeo map.
Limitation: The Galigeo Custom Visual for Power BI is limited to 10,000 representable objects on the map. If the Power BI dataset used by the map exceeds 10,000 rows, only the first 10,000 rows will be represented.
Data Mapping
If no Longitude and Latitude fields have been provided and the map does not already contain a geographic layer, a Data mapping wizard automatically appears to help you link your Power BI data to a geographic map. This wizard is only available for users with the Creator role.
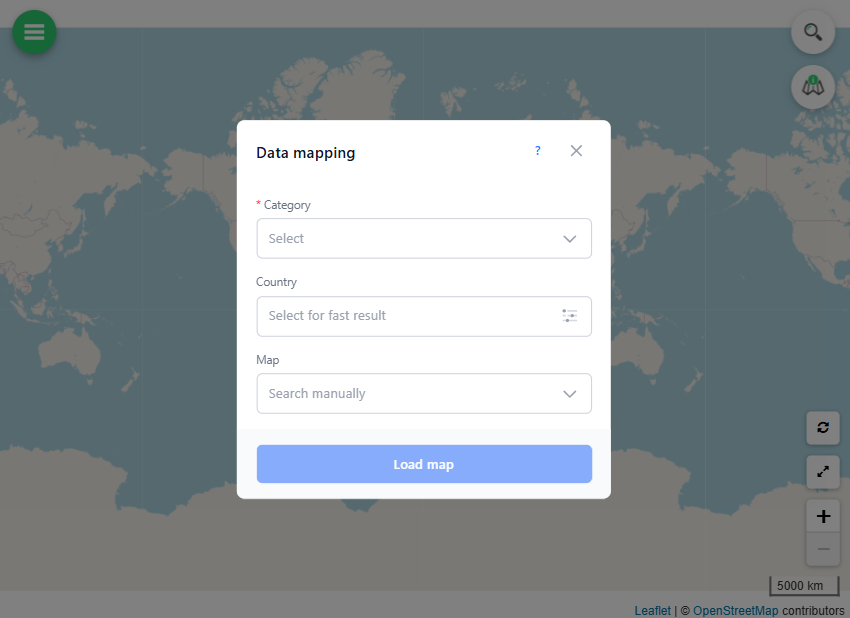
The wizard contains the following fields:
- Category (required): select the field from your dataset that identifies your geographic entities (e.g. a department code, a city name, a postal code, etc.). This is the field that will be used to match your data with a geographic map.
- Country: optionally, select a country to narrow down the search and get faster results. Only countries available in the Galigeo catalog are listed.
- Map: optionally, select a specific map from the Galigeo catalog to join your data with. If left empty, the system will search across all available maps.
Click the Load map button to start the automatic matching process. Galigeo will analyze your data and search for the best geographic match in its catalog.
Once the search is complete, the results are displayed:
- A matches found dropdown appears, listing the geographic maps that match your data along with a match percentage and the geographic field used for the join. The best match is automatically selected.
- A Measure/Category dropdown allows you to optionally select a data field to use for coloring or symbology on the map.
Select the desired match and click Open map to load the map with your data. The wizard closes and your Power BI data is displayed on the Galigeo map.
Editing the Map
By default, the Galigeo map opens in Viewer mode (read-only). To access editing features, click the padlock icon  to authenticate with your Galigeo user. If OAuth2 authentication is enabled for the organization, it is applied automatically.
Cognos Analytics
Prerequisites
To incorporate a Galigeo map into a Cognos report, users must work in Report Studio and insert a Custom Control, which represents an advanced tool in the latest Cognos Analytics version.
The Galigeo Custom Control is added in Report Studio, though the actual map design occurs in the Cognos viewer due to technical constraints of the HTML View in Report Studio.
Supported platforms:
- Only the new HTML5 Cognos Portal is supported
- Only the standard Cognos reports are supported
- The "Active Reports" and "Dashboards", that do not support the Cognos custom controls, are not supported
- Cognos reports scheduling is not supported
User requirements:
Report designers must have the Galigeo Creator profile to configure maps and establish layers on BI indicators. Standard Cognos users receive the Viewer profile by default and cannot modify maps.
Data requirements:
BI indicators to map must be associated to a geographic dimension, alphanumeric or numeric (e.g. FIPS), or numeric geographic coordinates (e.g. latitude, longitude). This positioning allows the indicator placement on the map.
Steps
Open the report in Report Studio in Edit mode.
Navigate to Toolbox > Advanced in the left menu and drag a Custom Control to the desired report location.
Two types of Custom Control are available:
- Map type: embeds maps representing the attached data
- Menu type: provides two functions:
- Print PDF functionality
- Copy Maps (limited to users with write permissions)
Configure the Custom Control properties:
| Property | Value |
|---|---|
| Description | A label identifying the control |
| UI Type | Select "UI without event propagation" |
| Module Path | http://<ggo-server>:<ggo-port>/Galigeo/viewer/jsp/lib/customControl.js |
| Configuration | JSON string containing the parameters (see below) |
| Height | Height in pixels (e.g. 500px) — not required for the Menu type |
| Width | Width in pixels (e.g. 950px) — not required for the Menu type |
| Name | A name identifying the control |
Map Configuration example:
{
  "ggoUrl": "http://ggo-srv:8080/Galigeo",
  "blockID": "g001"
}
Menu Configuration example:
{
  "ggoUrl": "http://demo.galigeo.com/Galigeo",
  "ggoMenu": "standalone"
}
blockIDmust be a unique identifier and must not contain underscores.
Add Data Sets
Click on the Custom Control and select the Add data set button (+). Multiple datasets can be assigned to one control.
- Drag geographic dimensions into the Categories section
- Drag BI measures into the Values section
Multiple independent Galigeo Custom Controls can be inserted within one report.
Map Design
Save the report from Report Studio and open it using the Cognos viewer in HTML5 mode. The Galigeo smart mapping engine creates a layer by default using the last indicator in the list.
WebIntelligence (WebI)
Prerequisites
In order to add a Galigeo map into a WebIntelligence document, one must be in Design with Data mode and insert a Custom Element, a WebI menu available in the last version of the BI Launchpad portal.
Supported platforms:
- With BI 4.2, only the classical "BI Launch Pad" portal (
…/BOE/BI) is supported. The new Fiori "BI Next Generation Launch Pad" portal (…/BOE/BILaunchpad) is not supported. - Only the WebI HTML creation mode is supported; the Java WebI applet is not supported.
- The WebI Rich Client is not supported.
User requirements:
One must be a WebI designer to insert a Galigeo map into a WebI document, with the same title as a classical table or graphic. Additionally, one must have the Galigeo Creator profile to configure the map and create cartographic analysis on BI indicators.
The issued maps can be visualized by all BI Launchpad users. By default, a WebI user has the Galigeo Viewer profile and cannot modify maps and their content. The Galigeo profile assigned to a WebI user can be modified in the Administration tool.
Data requirements:
BI indicators to map must be associated to a geographic dimension, alphanumeric or numeric (e.g. FIPS), or numeric geographic coordinates (e.g. latitude, longitude). This positioning allows the indicator placement on the map.
Steps
Open a WebIntelligence document in Design > with Data mode or Structure only.
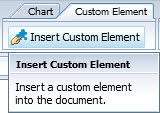
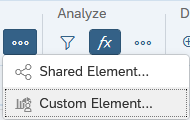
In the menu above, go to the section Custom Element, click on Insert Custom Element.
Place the insertion pointer at the desired spot in the WebI tab.
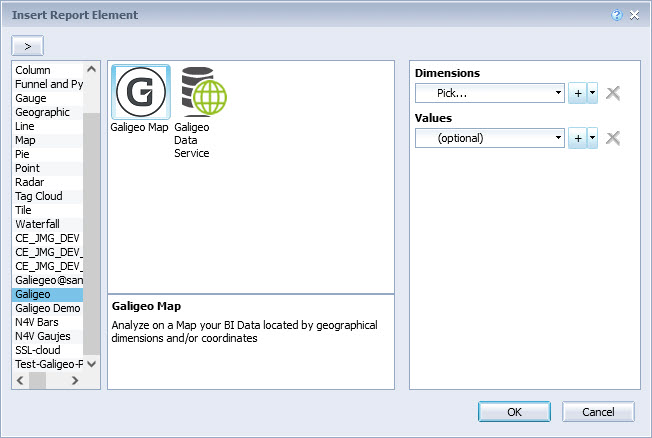
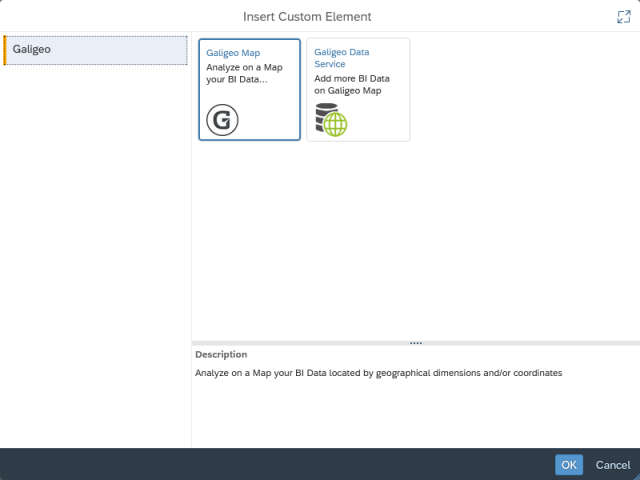
In the Insert Report Element dialog:
- In the left section, select the Galigeo element desired: Galigeo Map or Galigeo Data Service
- In the right section of data assignment:
- Dimensions: Select at least one geographical dimension and/or geographic coordinates. One can also select one or several non-geographic dimensions that can be visualized on the map.
- Values: Select the BI indicators (at least one) to analyze on the map
Once the data is selected, click OK. The map is inserted at the desired place with a default size. The map is resizable and repositionable like any other WebI element. The Galigeo smart mapping engine creates a layer by default using the last indicator in the list.
It is possible to insert several maps in one tab.
Save the document.
Several BI DataSets in a Map
Besides the default dataset associated to the custom element Galigeo Map, it is possible to have additional datasets derived from the WebI document available in the map. For this purpose, there is a new custom element accessible: Galigeo Data Service.
The recommended procedure is as follows, particularly for the correct viewing of maps in PDF format:
- In the actual tab, insert first one or several custom elements Galigeo Data Service by selecting for each the dimensions and the values that are desired to be displayed.
- Then insert the Galigeo Map custom element. The additional datasets are then automatically available in the map.
Scheduling a Report with a Map
When scheduling a WebI report with a map, only Web Intelligence and PDF (Adobe Acrobat in schedule menu) format are supported.
In the Schedule assistant > Destinations menu, Default Enterprise Location is the only supported destination. The "Delivery rules" menu, which concerns other destinations, is not applicable. Caching ("Schedule > Caching" menu) has no effect on Galigeo maps.
"Copy / Paste" or "Save as" a WebI Document with a Map
With BI 4.2 SPx or BI 4.3 SP2: "copy / paste" or "Save as" a WebI document with a map are both supported. To finalize a "copy / paste", it is necessary to open the WebI document once as a "Galigeo author" and display the map.
With BI 4.3 SP1-5 & 2025: Only "copy / paste" is supported with the same finalization step as above. "Save as" is not supported.
PDF Export of a WebI Document with a Map
When using PDF BO visualization, due to a limitation linked to the PDF BO cache, it is recommended to refresh the WebI document before printing if you change the visibility of the layers or the extent of the map.