The Interactive Map
General Presentation
The map viewer offers a powerful and easy to use user experience to visualize and analyze your data:
- Visualize your data on a map
- Create layers: choose your indicators, statistical classification methods, rich visualizations
- Navigate and explore your data and layers
- Select area or points of interest and calculate new metrics and statistics
- Query data to get more information or detailed reports
The application has a very neat ergonomic, modular and scalable in order to facilitate the adoption and to better respond to the users' expectations.
Galigeo users of type "Consumer" have access to the main functionalities that allows them to visualize, update, navigate, explore, and query the data.
Galigeo users of type "Author" have access to the totality of functionalities, and especially those for creation and modification of layers.
In the right bottom corner there are 6 buttons with the following functions:
- Map sharing (see section 3.4.18)
- Online help
- Display the base map in 3D
- Zoom in
- Zoom out
- Return to the previous extent
Display by Default
As a map is displayed, this one is loading together with the following elements:
| Element | Description |
|---|---|
| Layer by default | The layers displayed are those that were checked at the moment of saving the view (see the chapter about the widgets, Layers Management). |
| Base Maps | The base maps loaded are those defined for the map view on which is based this map (configured by the administrator). |
| Zoom by default | The map is centered on the geographic zone defined by the "Zoom On" option or the extent defined in the configuration file. |
Refreshing the Map
When the Galigeo Enterprise map is refreshed, for example for getting the BI data on a different scope (change of the prompt values), the mapping working environment is reinitialized:
- The map extent is lost and reset according to the administrator defined rules.
- The opened tools are closed; only the widgets configured to open at loading of the map will open.
Functionalities Description
Toolbar
The map offers intuitive navigation tools of type zoom up, zoom down and pan.
The toolbar contains the links (icons that can be clicked) to the widgets (main functionalities) of the application.
To open a widget, click on the corresponding icon.
Views Management
A Galigeo map is composed of a set of views. A view is defined by:
- A basemap
- An extent
- The visibility of layers
- The status compressed/deployed of different layer groups
- Filters values
By default an empty map has a view having the map's name.
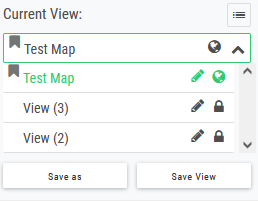
The new view button allows, when clicked, the creation of a new view. By default, the new view takes the parameters of the map in the moment of creation (visible layers, extent, etc.).
It is possible any time to save the current view by clicking on the save view button.
The more options button allows the access to more options:
- Status: a public view is visible to all users. A private view is visible only to its creator
- Default View: allows to define the view to be used by default at the opening of a map
When there are multiple views on a map, you can quickly navigate from one view to another using a widget located in the bottom left corner of the map.
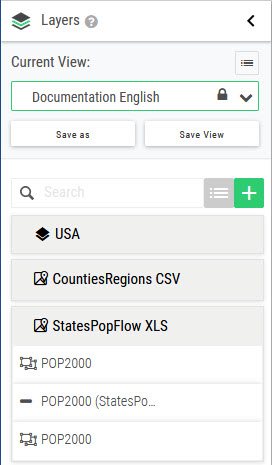
Layers Management
The "Layers" panel allows the generation of layers that are displayed on the map (with the exception of the territory projects). The layers are regrouped in groups where the name and the state deployed/compressed can be saved by saving the view.
Allows to manage three types of layers: the layers active on the map, the Webservices, that are inside the groups, and the annotations.
A group name, as well as a layer name, can be modified by author users, by clicking on the edition icon besides the name. This functionality is not available for explorers and viewers.
It is possible to change the order of layers in the same group, by drag and dropping the layer, with the condition that the layers are of the same type (points-lines-polygons). The order of points-lines-polygons will be preserved.
It is possible to activate or deactivate a layer on the map, and also to activate or deactivate a filter and/or display labels for layers by hovering with mouse over the layers.
The Layers
The layers are grouped by layers of objects, like the States, Counties, Cities, Companies...
All users can display or mask a layer on the map.
The users having the role of Author can create, edit and delete layers on the map.
By expanding a layer from this panel control buttons become available:
| Icon | Description |
|---|---|
| Hexagons | Hexagons consist in projecting a layer of points on a hexagonal grid. Available only for ranges of colors layers of points. |
| Heatmap | The heatmaps allow the displaying of a heatmap of a points layer calculated from a numerical indicator or from the points density. |
| Cluster | Allows the automatic aggregation of points that are close by means of clusters. |
| Labels | This functionality allows the toggling of the display of labels, if already configured in the Layer Wizard. |
| Delete | This button allows the deletion of layers. |
| Rename | This button allows the modification of the layer name. |
| Edit | This button allows the modification of existing layers via the Layer Wizard. |
| Zoom | This button allows zooming to the extent of the layer. |
| Filter | This button allows creating filters on layers. |
You can display only one representation of type cluster/heatmap simultaneously on the map.
The Webservices
The Webservices are dynamic layers resulting from an ArcGIS Server. They allow the enriching of maps by displaying supplementary information, independent of the data providers.
All users can make the Webservices visible or invisible on the map. The adding of Webservices is done from the Settings page.
Annotation Layers
The annotation layers allow the free drawing on the map in order to annotate information. The annotations are private, i.e. each one can see the own drawing layers. It is possible to share annotation layers between users or maps using the import/export functionalities.
The annotations are of three types: polyline, polygons, points. If the lock is activated, the layer becomes private, and it is visible/accessible only to the user that created it.
It is possible to modify the properties of an annotation (symbol, colour, label) by clicking on it. As an annotation is about to be edited, it is also possible to modify its geometry.
$GALIGEO_HOME\images\drawSymbols. System administrators can update the list by placing custom SVG files in the directory.
Clicking on an annotation will display:
- for a polyline: the total length
- for a polygon: the surface
- for a point: the xy coordinates
The import/export buttons allow the importing/exporting of an annotation layer in the form of a geojson file.
Working Layers Selection
This button opens a dialog allowing the configuration of the list of layers that will be displayed in the Layers panel.
The selection of these masked or not layers allows to keep an uncluttered working map while retaining the functional richness since the user has the choice to draw new layers to represent new data.
The author when preparing a map, can thus select the layers by default for all users. The saving of the View will save this selection.
Adding of Layers (authors)
This button opens a menu with which it is possible to add new layers on the map:
- Layers
- Annotation layers
Filter on the Layer
This functionality allows the filtering of a layer's data by a field and a value.
There are two modes available to the author: a simple mode and an advanced mode.
In simple mode the author is guided in his endeavour. It is enough to select a field from the suggestions list, then an operator that is also in a list of suggestions.
To finish, the author has to enter a value in the dedicated text field. According to the entered text a list can be suggested by the auto-completion function.
If the filter has to have several conditions, the author can go in advanced mode. A text field to enter the filter is then available. The author has to have SQL knowledge.
Example: QueryName.FieldName > value1 AND QueryName.FieldName = value2
The fields from different queries can have identical name. In order to avoid the confusion, a fields list is available. In order to have this list displayed, the author has to click on the fields list symbol. In order to avoid errors, it is strongly suggested to select the fields from this list.
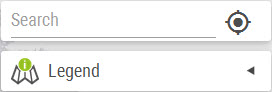
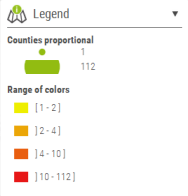
Legend
The legend shows the representation of the visible layers on the map.
It is recalculated dynamically from the basic data in function of the filters defined by the user.
The Info Window
The info window displays on a simple click on an object of a layer the information associated to it at the right side of the map.
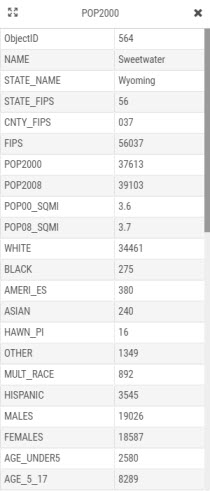
This info window is configurable to show the key data to the user. The selection of alias and visible fields is done from the Data panel.
It is also possible to customize the outlook and content of the info-window by going to the Settings page (for authors only) and selecting Custom on the associated switch, one can enter custom HTML code in the correspondent input window.
In the left upper corner, there is also a zoom to button that allows the zooming to the clicked object(s).
If, due to the level of zoom, several object representations overlap, the info-window will show the information on all of them in a multi-layer look.
The Basemaps
A large variety of base maps is available: ESRI ArcGIS Online, OpenStreetMaps,...
They are to be used according to the terms and conditions of the corresponding provider.
The available base maps are configurable by the administrator.
If your rights allow, you can save your basemap choice by saving the view in the "Layers" panel.
The use of basemaps standard Galigeo needs access to the Internet. It is possible that certain basemaps are blocked by the security policy in your organization. Please, contact your administrator in case you experience this problem.
The basemaps list is configurable by your administrator. It is possible to delete or add basemaps. These basemaps can also come from an internal server in your organization (ESRI ArcGIS Server, WMTS or WMS).
The base maps list is customizable at application level (see the appendix chapter "Basemap Configuration").
The Empty Basemap
If it does not appear it is possible that your list was customized or that you inherited an ancient configuration. In this case, contact your administrator and check the administration guide.
3D Basemaps
The 3D basemap can be activated by clicking on the 3D button at the right hand side of the map. By clicking on this button, an automatic zoom is performed to the level where 3D buildings are visible.
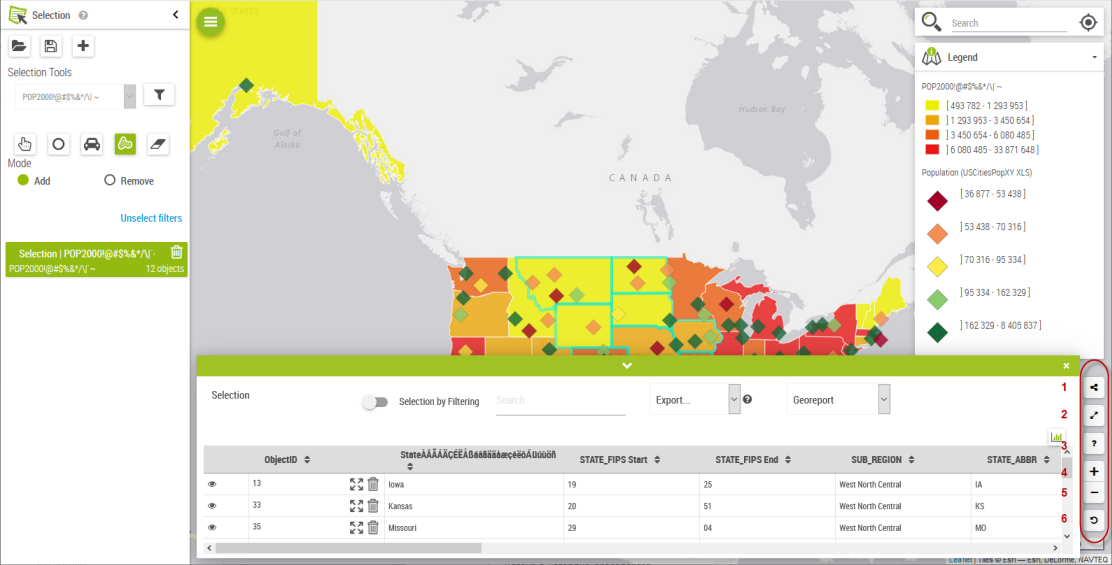
Selection
The user has powerful tools to select objects of interest on the map and to analyze them:
- Filtering before doing a selection
- Selection by iso-distance, by driving time (isochrony) (if available) around a point, by click or by drawing a free hand area
- Display of detailed data of these objects in a table
- Statistical analysis of the selection
- Export/Import of the selection, export of data in CSV format
- Display of detailed BI georeports filtered by the geographic selection
- Zoom on an object in the selection using the "zoom to" button
- Delete an object from a selection by using the "recycling bin" button
- Disable previous filters by clicking on the "Unselect filters" link or by clicking on the "Delete" button in the filter UI
Before doing a selection, one can do a filtering using the layer filtering tool by clicking on the filter button close to the drop-down list of the datasources.
After the execution, the selected layer will be filtered according to the query done, and the result will be displayed in the below panel and we can export it in CSV, Excel, Geojson, and Shapefile.
After doing an eventual filtering on the layer, you can select objects using the following tools: pointer, circle, isochrony (if available), and freehand polygon.
For selections done with the Isodistance, Travel Time Selection and Freehand Selection tools, there is also the Selection by Centroid option. If unchecked, the selection will take all the objects intersected by the selection circle/polygon. If checked, only the objects whose centroids are contained in the selection circle/polygon will be selected.
You can also export the selections in format CSV and Georeport.
Statistical analysis:
Street View (extension)
For more details you can consult the Chapter 7.1 Street View in Extension Modules.
Search
This tool suggests with the help of auto complete, the address corresponding to the entered search and allows, after selecting a suggested address, the location on the map.
Locate Me
This function allows the own geo-location on the actual map.
It uses the geo-location of the browser which can be different in function of the used browser and device (iPad, PC connected to the Internet).
This functionality is pertinent for the mobile use.
Print Functionality
When clicked, it displays the print configuration panel.
With the Destination list it is possible to choose between several printing formats:
- Screen Capture: allows taking a simple screen shot of the map without supplementary elements (no legend, scale, navigation panel, ...)
- Screenshot with legend: allows taking a simple screenshot of the map with the legend without supplementary elements (no scale, or navigation panel)
- The following destinations A3 LANDSCAPE/PORTRAIT, A4 LANDSCAPE and US Letter LANDSCAPE/PORTRAIT correspond to a server print mode. When a template is selected, a gray frame indicates the footprint of the model on the map.
- Define as thumbnail in the portal: changes the thumbnail of the map in the portal
It is possible to add templates in HTML format for this type of print (see Settings).
The screenshots print always in PNG format without any associated title. For the server prints it is possible to choose a title and to choose the format: image (PNG) or PDF.
Motion Maps
Motion Map Configuration
Icon: ![]()
The motion maps allow the automatic filtering of the map according to one animation axis (usually it is time) defined by the author. As soon as one or several filters are defined, the user can play with ease with these filters using a proper control element (see next section).
The motion maps are configured from the left panel, available only to authors. The configuration panel is available only to the authors.
It offers to the author the possibility to choose the animation axis that will serve to animate the map:
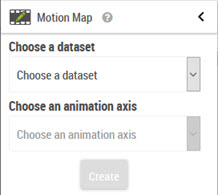
On this panel one can choose the data set on which the Motion Map is based, and the animation axis.
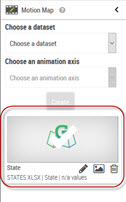
Once these two parameters are selected, click on the "Create" button to add the new motion map. The name as it will be displayed for the user can be customized by clicking on the edition button. You will have from now on access to the motion map control button (see below).
You have the possibility to choose to see one of the motion maps available on the panel. You can customize the name, the picture or you can delete it.
Motion Map Control
Once one or several motion map filters are defined, the player is displayed automatically at the right top of the viewer. By selecting a Motion Map filter, the map is filtered according to the position of the cursor for the selected dimension:

The functions of the buttons are as follows from left to right:
- Repeat: it repeats the motion endlessly without any external intervention.
- One step back: it moves the motion cursor one step back from the actual position, updating the map.
- Play/Pause: sets the animation into motion with the speed chosen between 2 steps, or pauses it.
- One step forward: it advances the motion cursor one step forward from the actual position, updating the map.
- Set motion speed: one can choose the time interval between the display of two consecutive instances (0.5s, 1s & 2s). By default it is set to 1s.
Data Management
For more details, please consult Chapter 6: Data Management.
Territory Management (extension)
For more details, please consult Territory Management.
Linear Referencing (extension)
The Linear Referencing allows the representing on a map of data using an axis and a distance in kilometers. This way of referencing is useful when the data is based on a complex linear network (roads, railroads, gas, electricity, etc.) because it allows the simple localizing of an event.
For instance: Accident at kilometer 23 of the A1 highway.
Prerequisites
- The option Linear Referencing has to be activated in the product license
- A geographic layer of lines cut up in sections and containing the following pieces of information for each section:
- An axis identifier to which the section belongs
- The distance in kilometers from the beginning of the section
- The distance in kilometers from the end of the section
- For the BI data, the following pieces of information are required for each record:
- The axis identifier
- A distance in kilometers existing between the available sections
Example of spatial data:
| Axis | Segment | Beginning | End |
|---|---|---|---|
| A1 | T1 | 0 | 10200 |
| A1 | T2 | 10200 | 30000 |
| A1 | T3 | 30000 | 55000 |
Setting up
The Linear Referencing setup is done in the Mapping tab from the Data panel. The data to enter are the one described in the prerequisites.
- For the BI data, enter the name of the column serving as axis identifier, as well as the column name representing the distance
- For the GIS data, enter the corresponding columns for the axis name, the join fields and the values for the beginning and the end of the sections
The result of the mapping is a points layer containing the BI attributes.
By default, the application is expecting to receive the distance in meters. If however the BI data or the GIS data use another unit, it is possible to change this parameter for the whole application in the following manner:
- Edit the
$GALIGEO_HOME/config/gaia.propertiesfile - Modify the values for the parameters
linear_gis_ref_unitandlinear_ref_bi_unit. The possible values are "m" or "km".
Filters
The filters allow the defining of the scope of the data that are used in the application.
Each filter allows to choose one or more values for each criteria of analysis in the lists of values or a calendar for dates or an input text.
The available filters and the associated lists of values are configurable and managed by the system administrator.
The filters can be of different natures according to the analysis criteria: multiple choice list, mono, date, or free text. They also can represent an objects hierarchy.
The filters are defined by the author from the settings page.
Map Sharing (only Cloud)
It is possible to share a map by sending it by e-mail directly from the viewer.
In order to do that, it is enough to click on the share icon situated at the right bottom corner of the map.
Then the target addresses will be entered, your own address, and it is also possible to select if a copy should be sent to the one who shared the map.
There is a default message, however it can be changed as desired.